 |
|
ACD Systems is one of the largest and most respected independent digital image editing and management companies in the world. The company was founded in 1993 in Texas by technology and imaging visionary Doug Vandekerkhove. Doug foresaw the importance of the convergence of analog and digital (print, photos, scans, video and metadata) in the 80’s, revolutionizing how analog and digital information was used in pre-Web applications. Today ACD holds seven patents, and millions of ACDSee products are in use throughout the world.
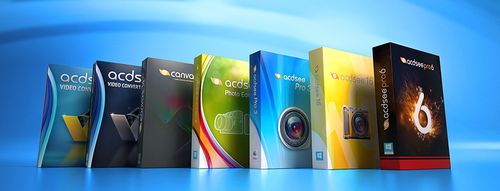
ACD Systems has offices in the United States and Canada, supported by a team of global channel partners. With a product family that includes ACDSee Pro 6, ACDSee Pro 2 (Mac), ACDSee 16 photo editing and management solutions, and Canvas technical illustration software, the company serves millions of consumers, small and medium sized businesses, government agencies and educational institutions, and corporate customers.
Representative markets for ACD Systems' products include AEC (architecture, engineering and construction), insurance, manufacturing, aerospace, automotive, government, architecture/construction, education, gaming, technology, bio/health and oil/gas/energy. Customers include General Motors, Caterpillar, Boeing, The New York City Fire Department, NASA, CNN and the Royal Canadian Mounted Police. ACDSee software was used in the making of the movie Titanic because the filmmakers recognized that only ACDSee could provide the illustration, editing and management tools required for their large scale, complex development tasks and image management requirements.
|
| |
|
| |
Canvas 14 is how
engineers and technical graphics professionals illustrate and
communicate with confidence.
|
|
 |

Create, enhance and share technical illustrations - Canvas 14 is all you need
Looking for a single technical graphics solution? Analyze, enhance and share your rich information with ease, precision, and pro results, using just one integrated application.
Canvas 14 is how engineers and technical graphics professionals illustrate and communicate with confidence. Canvas’ minimum precision levels and powerful object illustration and image editing tools ensure that the accuracy of your data is maintained from import right through to publication and beyond. Accelerate and streamline your technical illustration workflow from initial import and design to final presentation, facilitate collaboration, and improve your overall productivity with this complete technical illustration software solution.
|
|
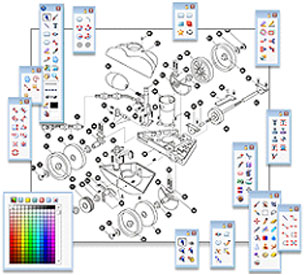
Technical Illustration
As the preferred choice of technical illustrators in precision
industries, Canvas 14 comes with all the powerful vector object illustration
and advanced raster image editing tools you need, in one integrated,
flexible design environment.
Technical Illustration and Enhancement with Greater Control
Work with vector and raster images
Canvas’ integrated design environment lets you work with both vector
graphics and raster images in the same document, with the same powerful
enhancement tools.
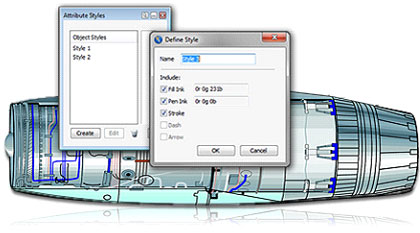
Draw and Edit with Precision
Resize and scale objects, add fill and stroke inks, widths and other
attributes, and draw shapes – all with measured precision and placement.
Take advantage of specialized tools to draw complex shapes including rounded
rectangles, complex polygons, cubes, spirals, grids and rectangular boxes in
isometric views. Draw and edit paths and curve segments using the control
points that define them.
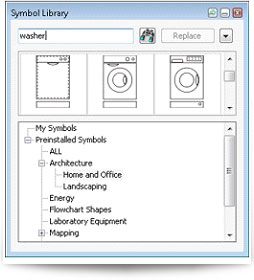
Add on-the-fly illustration objects
Instantly add re-usable dynamic objects to drawings. Access thousands of
commonly used and specialized technical symbols from Canvas 14's pre-loaded
Symbol Library collection, or create your own custom symbols using any
vector, text or composite object.
Symbol categories include:
- Buildings
- Cartography
- Electrical
- Energy
- Environmental
- Transportation
- Landscaping
- Oil & Gas
- Flowchart symbols
- Forensics
- Home & Office
- Hydrologic
- Laboratory Equipment
- Packaging & Shipping
- Power Utilities
- Mining
Work flexibly with vector objects
Illustrate, edit and augment all forms of complex visual objects with
Canvas 14's wide variety of professional tools and powerful Sprite
technology. Canvas’ proprietary SpriteLayers™ and SpriteEffects™ can be used
to apply image and transparency effects without rendering; all your graphics
remain completely editable. Specialized technologies such as channel masks,
vector masks, gradient transparency tools and opacity effects are also
available for advanced techniques.
Access raster image editing tools
Create, edit and augment raster images, including GIF, JPG, TIFF,
PICT, BMP and EPS, with a host of industry standard and specialized
techniques, tools and filters. Design image compositions, retouch
photos, paint and color-correct scanned images, create transparency
effects, clone pixels and much more. Do more with CAD files
Canvas 14 gives you a 3D View and CGM support, as well as
CAD-inspired dimensioning tools, creating a seamless complement to
AutoCAD® environments. Feel free to size, scale and manipulate CAD
objects in the Canvas environment without any loss of data. Paste Into command
Paste almost anything into a selection within an image, including a
selection of a raster image channel, or of a channel mask that’s
attached to another object.
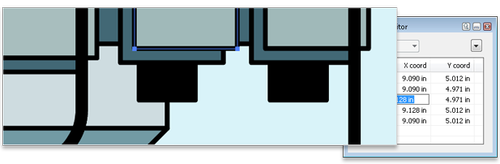
Edit geometry and position data
Completely control vector object coordinates to ensure the accuracy
demanded in many engineering and scientific work environments. Create
illustrations from geometric data alone, or blend these precise data
controls with more traditional illustration techniques in one seamless work
environment. At any time, you can view a vector object’s exact width,
height, position, reference point and other coordinates via Canvas 14’s
Properties Bar, and adjust its numerical position for true precision.
Create rich data flowcharts
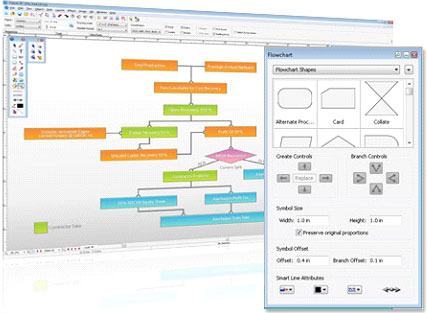
Present visually complex information in a logical and easy to understand
format. With Canvas 14's Flowchart palette you can design data flowcharts
with unprecedented speed and flexibility. Simply select your symbol size,
shape and SmartLine™ attributes, and click to place. Customize your
flowchart with connection line and shape editing options to complement the
overall look and feel of your document.
|
ANNOTATE, ENHANCE and DIMENSION
Enhance your technical vision with Canvas 14.
Add clarity to your illustration with labels or text, add format dimensions,
create dynamic charts, or use Canvas’ unique lens for a more detailed view.
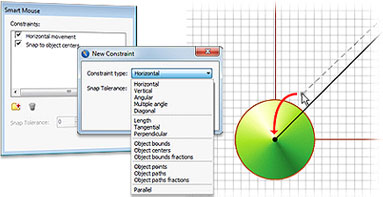
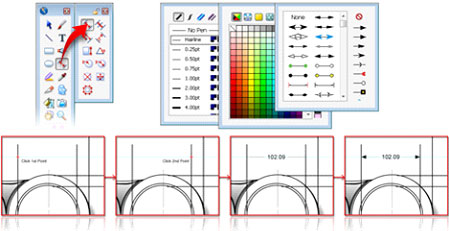
Add format dimensions
Canvas 14's Linear, Chain and Baseline
Dimensioning tools precisely control horizontal, vertical, oblique and
perpendicular distances; measure diameter, radius, angle, area and
perimeter; and mark the centers of arcs and ovals.
Add comments and mark-up
Use Canvas 14's annotation tools to add
labels or callouts to your diagrams and illustrations, complete with custom
and automated options such as single and multiple diagram line connections.
And if you re-position the annotation label object, the SmartLines(tm)
connecting it to the illustration move right along with it.
Ensure the highest levels of precision
Work with very small units of measure with
engineered accuracy and control. Canvas 14’s drawing engine fully supports
the IEEE floating point standard used throughout the scientific,
engineering, medical and biotechnology industries. Canvas is indispensable
to professionals who work with images that contain up to 32 bits of floating
point data per channel.
Work within industry standards
Create dimension objects that fully conform
to existing industry and government standards, including:
- IEEE (Institute of
Electrical and Electronics Engineer's) floating point standard;
- ANSI (American National
Standards Institute) U.S. Product and industry standards;
- DIN (Deutsches Institut
für Normung/German Institute for Standardization) internationally
adopted standards;
- JIS (Japanese
Industrial Standard) standards.
Customize these standard settings by editing
the size of lines, gaps, text and tolerances, modifying them for new and
unique workflows, and saving them for ongoing use in similar work contexts.

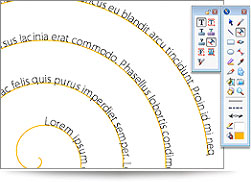
Do more with text
Add professionally formatted and fully
editable text to vector objects and raster images. Create multi-page text
documents and technical publications using a full range of traditional text
formatting, proofing, annotation and style tools.
Work with GIS data
Canvas 14’s optional GIS module offers a
powerful set of GIS-based features and commands that support a range of
GIS formats, define complex map projections, and perform advanced
property operations. It's an indispensable tool for GIS professionals in
the oil & gas texand energy sectors, aerospace and automotive
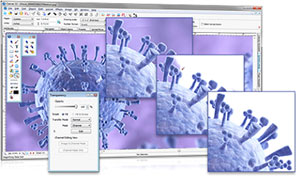
industries, education, and government. Get up close and personal
Canvas’ proprietary SpriteEffects allows
you to create lens objects to highlight specific elements of your
document. Lenses are powerful containers for effects and can be used to
create magnifying glasses and other viewing frames within illustration
documents.
Create dynamic charts - NEW
Create and customize visually appealing
dynamic charts and tables in a variety of formats using data inputted
directly into Canvas: no need to import a static, pre-created chart from an
external spreadsheet program.
|
SHARE
Canvas 14 makes it quick and easy to share
your vision with professional publications and presentations, and to work
collaboratively with colleagues.
Access professional publishing tools
There's no need to use a separate word
processor or layout program when you have Canvas 14. A full range of
traditional text formatting and style tools are on hand to help you format
pages, create columns, layout text, wrap and bind. Tap into editing,
proofing and annotation tools to perfect your copy.
Create documents for every purpose
Canvas 14 offers time-saving templates to
make it easy to get a head start on any project:
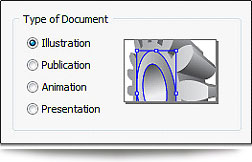
• IIlustration documents
are used for all forms of vector object illustration and raster image
creation and editing.•
Publication documents let you easily create single or
multiple-page technical publications, including two-sided facing pages.
Use master pages to hold common page elements. And when you are ready to
print, Canvas 14 gives you all the print and color management tools you
need for professional-looking output. • Presentation documents
are for on-screen slide-show presentations. Apply multiple layers, place
background elements on a master slide, and choose from over a dozen
slide transition effects. •
Animation documents are designed for the creation and editing
of web (GIF) animation files. Frames adjacent to the current frame
appear in the background, helpful for setting up object movement.
Collaborate with ease
Share, discuss and develop projects with
colleagues in a free-flowing document exchange. Canvas 14's advanced import
and export capabilities allow for the return of annotated illustrations to
the high-end specialized formats where they originated, without data loss.
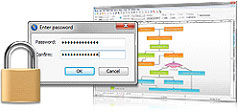
Share with confidence
Apply secure encryption and password
protection whenever you save your Canvas document or export to Adobe®PDF.
You have full control over who can open, edit and print your designs, and
your rich Canvas data. Canvas editing ability can be preserved, even through
the PDF conversion process.
Preserve Canvas data in a PDF files - NEW
Convert your Canvas 14 document to a PDF file
for sharing or storage and the native Canvas data will remain imbedded in
the file. Re-open your file in Canvas for further editing, with no loss of
your data or formatting.
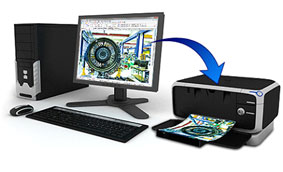
Print professionally
With Canvas 14, you can rest assured that
your projects will look as good on paper as they do on screen. Canvas
outputs multi-page Publication documents suitable for desktop and commercial
printing, including PostScript printers. Professional print and color
management tools, as well as all the advanced image and export formats
needed for virtually any publication context, are all on hand. Avoid
problematic color shifts and unexpected results by using the Kodak® color
management system to handle conversion between color systems, such as RGB
and CMYK.
Add interactivity to documents
With Canvas 14's Link Manager palette you can
insert hyperlinks, and export to HTML and Adobe® PDF with links intact. Web
publishing is supported by HTML and WebCGM files.
|
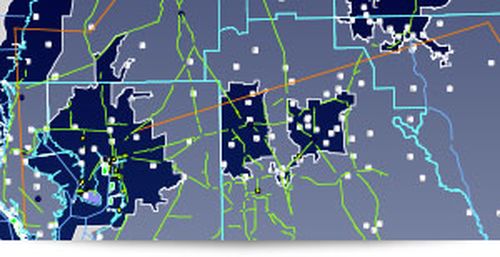
Your Complete GIS Data Solution
Canvas 14 with the optional GIS module offers
a powerful set of GIS-based features and commands that support a range of
GIS formats, define complex map projections, and perform advanced property
operations. It's an indispensable tool for GIS professionals in the oil &
gas and energy sectors, aerospace and automotive industries, education, and
government.
Streamline your workflow
Canvas 14 + GIS can handle all your GIS data
needs. Import the following GIS specialized file formats:
- TIFF (GeoTIFF TIFF/World File image,
+ pixel scale info. & location, in real world coordinates)
- SHP (Shapefile)
- E00 (ARC/INFO interchange)
- RT1 (Tiger, Topologically Integrated
Geographic Encoding and Referencing)
- SDTS (USGS Spatial Data Transfer
Standard)
- MIF (Mapinfo Data Interchange)
- S57 (International Hydrographic
Organization)
- ECW (Enhanced Compressed Wavelet
images)
- SID (MrSID)
- GML (Geography Markup Language)
- Geo JPEG
- Geo BMP (BMP + projection info.)
- Geo PNG (PNG + projection info.)
- Geo GIF (GIF + projection info.)
- GIS Text (TXT file with GIS data)
- GPS Garmin (TXT file containing GPS
Garmin data)
- DOQ/NES/SES/NWS/SWS (USGS Digital
Orthoquad Files)
- DLG/DO/OPT (DLG-O files)
Canvas 14 with GIS also supports export to
these GIS specialized formats:
TIFF, SHP, ECW, Geo JPEG, Geo BMP, Geo PNG, Geo GIF, and GIS Text.
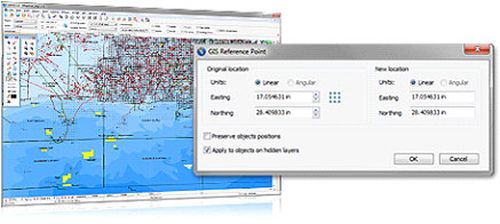
Create with precision
GIS Manager
Within Canvas' GIS Manager you can choose
settings to define geo-referencing information for a new document, or re-set
the projection of an open document. GIS Manager options include Projection,
Geo CS, Angular Units, Linear Units, Axis Orientation, and the Auto Define
Document Coordinate system dialog.
GIS Positioning palette
Strategically move or position objects
according to their latitude and longitude coordinates while displaying the
Length and Forward Azimuth when measuring between two points, and the
percentage of error. Measure distance in world coordinates by drawing and
selecting a line between two points.

Replicate and Position dialog
Create object replicates and precisely place
them according to latitude and longitude.
Graticule dialog
Create a grid of lines that displays
meridians of longitude and parallels of latitude while precisely controlling
its units of measure, precision decimal levels, longitude, latitude,
start/end points, spacing/divisions, latitude degree rotation, horizontal
and vertical offsets, and even the label format settings. Edit Geographic Coordinate System dialog
Define a geographic coordinate system for
a projection, and modify it with options such as Geo CS name, Ellipsoid,
Prime Meridian, and Datum Transformation. PointtoPoint command
Georegister a GIS drawing to the
geographic location of a “known good” reference image.
Auto Define Document Coordinate System
Set your GIS drawing scale and reference
point, and define a reference rectangle. Based on the selected point or
defined bounding box, Canvas then automatically sets up the projected
coordinate system for that file.
Visualize and enhance
The Select by Property interface lets you
create a project-specific customized query based upon unique properties,
values, or other related criteria. Edit your query to meet new project
needs, save for ongoing use, or share with colleagues.
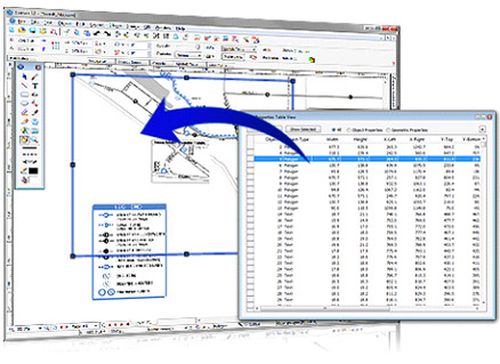
Object Properties
View, numerically edit and reapply map
attributes that have been assigned to map objects, via the Object Properties
Table View command. Label by Property
Perform a query and assign text labels to
map objects with defined settings such as text format, location, and
rotation angle. You can also apply or adjust collision detection
settings.
Visualize Data
Access many of the very detailed fill,
stroke, ink and GIS-specialized augmentation options required by GIS
data visualization. Modify the appearance of map objects according to a
selected property or a query to create thematic and choropleth maps.
Statistics by Property
View complete information regarding the
total number of map objects on a layer or within a selection.
Symbol Library palette and Visualize
Data command
Enhance map symbols to increase visual
appeal and dynamically replace them at any time to ensure project
consistency, through the Symbol Library palette and Visualize Data
command.

Image Warp and Coordinates commands
Quickly yet precisely warp GIS illustrations
with the Image Warp command. Or use the Coordinates command to place control
points within a selected image and warp it according to these points.
|
System Requirements
Hardware
- Intel®Pentium®4
or better
- 512 MB RAM installed (1 GB RAM
recommended)
- 700 MB free hard disk space (1.5 GB
recommended)
- 16-bit color or higher (True color
recommended)
- 1024x768 or higher screen resolution
recommended
- DVD drive (to install from the
installer disk)
Software
- Microsoft® Windows®
XP Home or Professional operating system (with Service Pack 2
installed), Windows Vista®, Windows® 7 or
Windows® 8
- Microsoft®Internet
Explorer®6.0 (7.0 or higher recommended)
|
 |
|
|
|


