think-cell is a small and fast-paced software company in Berlin, Germany. We know that our success is based on the skills and dedication of our team members. Therefore, we try to create a working environment that is friendly and welcoming and makes exceptional people come and stay.
think-cell is the de facto standard when it comes to professional presentations in Microsoft PowerPoint. Since the company is completely independent from any strategic or financial investors and highly profitable, we can fully concentrate on improving our existing software and innovating new products.
To continuously meet the demands of our customers with a product that is expertly tailored to their needs, we make no compromises with regard to code quality. Our software developers are accomplished experts in their field. We give them room for cutting-edge ideas and solutions, and we only release our software once it is ready.
New
think-cell 9
On June 11th, think-cell, the leading provider of productivity software for PowerPoint users, announced that it is launching think-cell version 9, the artificial intelligence (AI)-powered update of its signature software, which empowers users to create PowerPoint presentations with stunning charts and layouts in minutes.
"Building visually stunning presentations can be a pain-staking manual process even for the most qualified graphics experts," said Markus Hannebauer, think-cell co-founder and CEO. "However, think-cell is committed to removing these burdensome roadblocks, encouraging PowerPoint users to re-imagine how they communicate data-driven insights and findings. Data is rapidly becoming the most valuable resource for businesses today, and the process of creating dynamic charts to interpret that data should never be more complex than the data itself."
“think-cell 9 is blending artificial intelligence, automation technology and unmatched industry perspective to ensure a faster and integrated slide layout process,” said Arno Schödl, co-founder and CTO at think-cell. “With think-cell the race against time is no longer an issue, allowing users to focus on communicating and implementing recommendations instead of pushing around shapes.”
Watch the walkthrough
Our CEO Markus Hannebauer shows you around and presents the most important new features of think-cell 9 in this nice short video. You can find further details below.
Automate your PowerPoint work
Creating slides in Microsoft PowerPoint is painstaking. Frequently used chart types and graphical elements are missing and there is nearly no automatic placement. Usually, you end up manually updating numbers and pushing around shapes.
think-cell is different. It is a powerful charting and layout software that automates your PowerPoint work and such improves slide creation efficiency and quality. Within minutes you get well-laid-out and great-looking slides.
Save 70% working time on charts
One of the leading consulting firms quantified think-cell's impact on chart production. One of their highly experienced graphics experts created and updated 48 typical slides using PowerPoint. The complete process took him over 10 hours.
The same graphics expert then received a short introduction to think-cell and started to create and update the slides using think-cell. He needed only 3 hours – saving 70% of net working time.
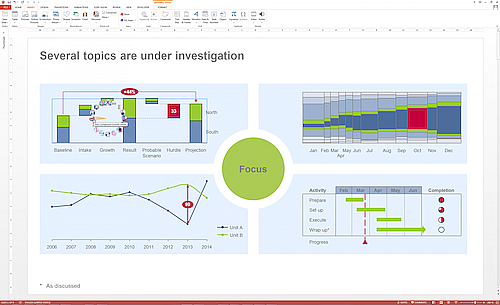
Beauty is not in the eye of the beholder
Are you always satisfied with the visual results you produce with PowerPoint? In particular at crunch time? If not, don't feel bad about it. Below is what people at leading consulting firms presented to their clients using just PowerPoint.
The second slide below shows what they created using think-cell to bring their own graphics knowledge to their users' desks. With think-cell you too will produce such beautiful results without any tweaking.
Don't worry about training
Tired of digging through dozens of toolbars, menus and property panes while looking for the right feature? think-cell avoids such clutter and has a simple user interface. The following three minute video shows you everything you need to know about using think-cell. And that's a promise!
Don't tie yourself to incompatible file formats
Other 3rd party software for PowerPoint often relies on non-native file formats for charts, such as Flash, images or completely proprietary formats. Using such software means that you put your digital assets at risk when you decide to stop using it or the vendor goes out of business. You won't be able to change hundreds, or even thousands of charts you created.
In contrast, think-cell uses only native PowerPoint charts and shapes for its output. Charts created with our software and shared with pure PowerPoint users remain data-driven and changeable. And should you ever decide to stop using think-cell, all your slides and charts will remain available and changeable as if you had created them with standard PowerPoint.
A wealth of features
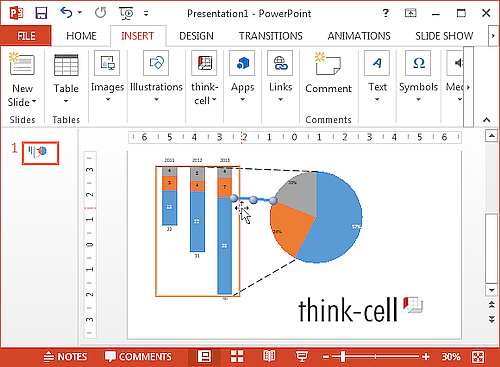
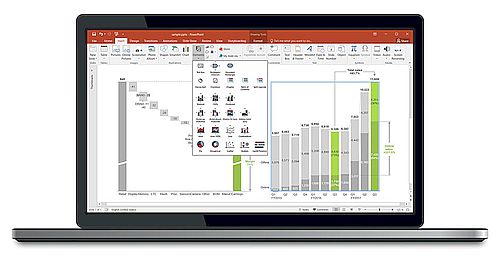
think-cell smoothly integrates into PowerPoint and brings you 40+ chart types, dozens of data-driven visual enhancements and other unique features, which you can find listed on this page.
You can simply access all features through the think-cell ribbon group, the circular context menu and direct one-click manipulation with your mouse.
Stacked column and bar chart
Stacked charts seem simple, but labeling, axes breaks and additional decorations can still take a lot of time. The video shows how think-cell helps in this regard and can therefore save you time even in case of common chart types.