Dedoose was conceived, designed, and developed by Eli Lieber, Ph.D a
research psychologist and Thomas S. Weisner, Ph.D a professor of
anthropology. Drs. Lieber and Weisner have years of experience
working together as co-directors of the Fieldwork and Qualitative
Data Research Laboratory in the Semel Institute, Center for Culture
and Health, UCLA and are the co-founders of SocioCultural Research
Consultants, LLC. Beyond developing and delivering Dedoose, SCRC is
here to support investigators engaged in qualitative and integrated
qualitative/quantitative research.
As proud as we are to bring you a fantastic research tool, SCRC is
much more than Dedoose. We are experts in supporting all aspects of
research and believe in the great value of implementing innovative,
reliable, rigorous, and valid methods. We are your gateway to a
network of professional researchers with both methodological and
applied experience and expertise.
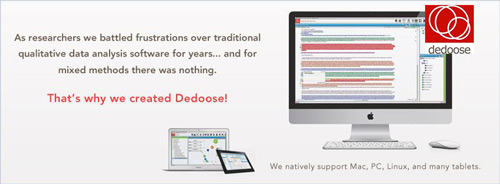
As researchers, we battled frustrations over traditional qualitative and mixed methods analysis software for years. It was clunky. It was expensive. It was hard to use. And, for the truly mixed methods stuff, it wasn't even there. We needed a better, cheaper, more collaborative and
user-friendly way to analyze our data. That's why we created Dedoose.
Dedoose is a web based application that allows users to analyze qualitative and mixed methods research data from any internet enabled device. Researchers and marketing teams use
Dedoose to excerpt, code, visualize and drill into integrated qualitative and quantitative
data - yielding new insights into key target markets and research populations. Dedoose was designed by researchers for researchers and our team remains firmly embedded within the professional academic research community. Dedoose was developed as a needed low cost alternative to
NVivo, Atlas.ti, Maxqda, and other qualitative data analysis software. Beyond traditional qualitative data analysis, Dedoose includes fully integrated mixed methods features and efficiently supports collaboration like nothing before in a multi-platform and user experience optimized environment.
Low Cost:
Our competitors charge thousands for clunky Windows based software...plus there is a charge for software updates. Dedoose runs on all operating systems, including Mac OS, in your web browser. And
we only charge per user for the months (1 unit per month) that it's actually used!
Collaboration:
Dedoose is teamwork, optimized. It is easy, efficient and safe. Gone are the days of having to make sure everyone on your team has the same software version, or waiting for teammates to finish their work and send files to you so you can dive into yours. With Dedoose, your team can be anywhere in the world. They can work on the same project at the same time.There are even tests in Dedoose that use
Cohen's Kappa to evaluate consistency in code application so you know that your analysis is sound. Security is also key when there are many moving parts. The project's administrator, not Dedoose, controls all user access privileges; determining who is authorized to view and modify all aspects of the project database.
On the Go Access:
Got a presentation across town? A class across campus? No problem. If you have Internet you are good to go. As a web based app, our users can access their information from anywhere on any computer, anytime, even from an iPad, Android, or tablet device.
Transparent and Intuitive Design:
From excerpting content to viewing any of the many auto-generated data visualizations, Dedoose is easy to use while still offerin g complex and powerful capabilities. This software was built by researchers, for researchers. The design is user friendly, not feature focused. Our flow is simple and intuitive so our users don't have to learn a brand new language just to use a software program.
Mac-Friendly Platform:
Dedoose is not just software. It's a platform of research tools that runs natively on a Mac, PC, or Linux system. It can run anywhere. On anything. Yes, ALL devices. We have the desktop app, the Android app, the browser app and more. Dedoose even runs on Mac operating systems without a virtua l machine (like most every other competitor out there).
How This Works
Buying Units:
Because we are a web app, partners purchase "units," or months of use, rather than licenses or software packages. Essentially, a user's account is funded with a set number of units based on their initial payment at sign up. For example, if a user purchases an annual subscription their account would be credited with 12 units, one per month (in addition to the free month trial). Each month on the anniversary date of the account creation, our system automatically checks to see if the user accessed Dedoose within the past 30 days and deducts appropriate units. The remaining units roll forward for future use. Once all the units have been used, the user will get a warning when they log in that they need to enter a new code or purchase additional units.
Important Notes:
Every Dedoose account is free for one month, regardless of the initial number of months purchased.
Users are not charged for any month they do not access Dedoose services.
By policy user behavior is not tracked -neither the frequency of logging in nor what its done within Dedoose. All charges are triggered automatically.
Qualitative Research and Mixed Methods Research Using Dedoose
Overview:
Dedoose was designed from the ground up—by researchers, for researchers—to meet the needs of today’s social scientists working in academia, marketing, and education—virtually anyone looking for innovative software to facilitate the search for answers to research questions via qualitative or qualitative and quantitative data. These data may be numbers, scale scores, demographics, stories, fieldnotes, vignettes, interview or focus group transcripts, photos, and the list goes on AND they may represent individuals, belief systems, settings, culture, relationships, and this list goes on too—clever research teams looking for rich, reliable, valid, and comprehensive answers to their research questions.
How is this being done? Through mixed methods! The creative integration of qualitative and quantitative approaches. Dedoose was designed and developed to serve the growing numbers of researchers who appreciate the value of bringing multiple methodological approaches together. When problems guide the methods (and not methods being forced onto problems) we increase the likelihood that appropriate perspectives will be implemented toward seeking answers. As research teams are increasingly crossing disciplinary boundaries, the integration of qualitative and quantitative approaches is quickly becoming the expectation for best practices in academia, business, marketing, education, and other fields of research and the application of research findings. Dedoose facilitates the exploration of data from multiple perspectives and will dramatically increase the efficiency, reliability, validity, interpretability, and presentation of your data management, analysis, and research findings.
Qualitative Research and Mixed Methods Research Using Dedoose
Orientation:
Scientific methods are the ‘how to’ aspects of a research project including who or what setting to be studied, which data to collect, how to collect these data, how to manage and integrate these data, and how to approach the data analysis. Qualitative methods are, by nature, relatively open-ended and include interviews, stories, observations, and notes. These data are typically approached through substantive content analysis, explored for a priori and emergent themes, excerpted and coded, and explored for the deeper patterns within commonly coded excerpts and the relations between differentially coded content. Quantitative methods include the use of measurement scales, checklists, tests, demographics, and the application of code weight systems and are typically analyzed through univariate, bivariate, and multivariate statistical techniques. Mixed method research is the flexible and creative application of some variety of approaches within a research project. In these studies, methodological decisions are problem-based, rather than method based, to allow researchers to benefit from the strengths inherent in both qualitative and quantitative approaches. This blending can take many forms and, accordingly, the approaches can be responsive and adaptive.
Qualitative data are valued for being rich, natural, detailed, contextualized, sensitive, and filled with the authentic and complex representations through which people communicate meaning in their lives. Quantitative data are highly structured, relatively inexpensive to collect and analyze, and central to the systematic study of empirical (numbers) properties and relationships. Quantitative data tell us a great deal about things like how many people are like ‘this or that’, which characteristics of the world are related to each other, and how many people benefited from a new program or intervention. Qualitative data tell us more about ‘how’ and ‘why’ things are happing in people’s day-to-day activities and routines, the nature of the relations between phenomena in the world, and the mechanisms through which people may have benefited from a new program or intervention. Naturally, getting the best of both from both approaches broadens and deepens our understanding of the phenomena on which we focus our research.
Dedoose was designed and built for one primary purpose—to facilitate the management and analysis of the data that come from mixed methods research. There are great tools for analyzing quantitative data and great tools for analyzing qualitative data, but Dedoose is breaking new ground in serving the growing number of researchers and research teams using qualitative and mixed methods by making it fast, easy, collaborative, effective, and inexpensive to carry out the data management, analysis, and presentation tasks that are fundamental to qualitative and mixed methods research.
Mixed Methods Research Done Right!
Features:
Web-Based
Dedoose is designed to work in all modern browsers
Login
- Your Browser, the Internet, and Adobe Flash is all you
need to access all Dedoose has to offer
Home
Dashboard — Login for instant access to all project
components
As a pure RIA (Rich Internet Application), Dedoose is built upon and
will grow with cutting edge technological developments. If you have a
computer and a browser, it's very likely your computer already has
absolutely everything you need to unleash all the power of Dedoose. And
being platform independent, it doesn’t matter what kind of computer you
are using, Windows based, Mac… whatever, you can use Dedoose right now,
for free!
What does web-based mean?
Nothing to download, install, or maintain on your computer, get
started instantly!
Automatic upgrades—it’s all included, new features are yours the
moment they go live, which is often!
Anytime, anywhere, any-computer availability — access Dedoose
from any web connected computer!
Teamwork oriented—multi-user, simultaneous, real-time access
with granular per user security
No hidden IT costs, no server required, no annual support fees,
it's all included!
Collaborative
Filter
by user to monitor or access the work by particular
individuals
While the individual user won't miss out on anything the system has
to offer, Dedoose was designed from the ground up to meet the needs of
multi-member project teams. Your project data and system features are
available to all authorized members of your team—simultaneously and
dynamically—all in real time. Regardless of where your team members work
or travel, the only thing they need to participate in your project is
access to the Internet, a browser, and passwords that your project
administrator provides and controls.
What does collaborative mean?
All team members can access Dedoose from anywhere, and work
together in real-time!
Granular access controls that allow project administrators to
edit security profiles that fit the needs of your project
Chat system allows all project members to communicate in
real-time
Increased data quality through cross-member reliability,
objectivity, and efficient communication
Tools to develop, calculate, and document inter-rater
reliability for both code application and code weighting
Transparent
Float over to view complete data behind excepts and data
visualizations
Click
through to view excerpt in the context of the source
resource
Highlight
to view excerpt and code application activity
Transparency is central to the design of all Dedoose features. You
can move seamlessly and naturally through all aspects of your database.
Dedoose keeps all data in context, always allowing you to click on any
piece to drill deeper, or easily return to where the information
originated. Throughout, Dedoose you have the ability to export any and
all of the work you’ve done in Dedoose into a variety of familiar
formats: charts, graphs, excerpts, descriptors …and importing is just as
easy
How does this help?
See quotations in context while exploring your resources,
building your tag/code system, or excerpting
With our migration tools, you can import your existing project
data from SurveyMonkey, Atlas.ti, NVivo, and more!
Drill down into your data through the compelling and informative
data visualizations and narrow your analysis with the Dedoose Data
Selector or other filtering features
Export your data from any place in the system into common file
formats—ready to open and access in the software you already own and
are comfortable using
Intuitive
Check-box
filtering and gauges for filter activity monitoring
Customizable
spreadsheet-familiar ‘Managers’ to view, browse, filter and
organize all aspects of the project database
Data
tips open when floating over charts and graphs to cue the
data being represented
We have a radically different design philosophy at Dedoose—enhance
user experience while interacting with every Dedoose feature, simple or
complex! This means that rather than building an application from a
bullet point list of features, we designed it from the perspective of
what users wish and need to accomplish and how best to support efficient
workflow. So, you won't find every feature plastered all over Dedoose.
Rather, features are present when you need them so your workflow makes
natural sense. This simplicity and efficiency has always been a core
part of our mission so that all users will have access to what they
need, when they need them, and it will all make intuitive sense so
research can be engaging and effective…Great Research Made Easy! From
the start, we expect you’ll find Dedoose to be easy to learn, logical,
attractive, and supportive whether you are a young student, early-career
professional, or experienced expert researcher. Features were conceived
to be straightforward and salient so every user can easily benefit from
what Dedoose has to offer. Working with Dedoose will come as naturally
as navigating a typical Website. Dedoose is intuitive and inviting,
encouraging you to make full use of its cutting-edge features.
Straightforward, logical, and supportive?
Dedoose has a small and shallow learning-curve—despite its
immensely powerful platform
So intuitive that many users never bother to read the user
guide, or watch the training videos!
Save on the outrageous training costs many find necessary to
make use of other non-intuitive software
Clear and consistent organization
Intelligent reminders and cues throughout—right there, when you
need them
Step-by-step user guide and video tutorials
Informative dashboards in every workspace, each filled with
instant menu-driven data visualizations
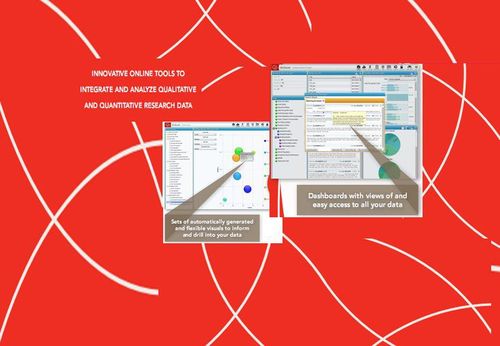
Visual
Menu-driven
evidence-based conceptual maps provide visual insights in
multiple dimensions with full click-through capabilities
Menu-driven
charting and graphing engine to quickly customize your
visuals for pattern discovery, drill-down access, and easy
export
Organize
and understand variation in your sample population at a
glance
Dedoose is rich with graphical and tabular presentations of your data
AND the work you’ve done with these data. Throughout Dedoose you are
instantly presented with interactive ‘pictures’ of your work. Every
visualization is easily controlled with menu-drive options to facilitate
your search for and understanding of patterns in your data. These
interactive and dynamic displays offer many alternative views and allow
fast and intuitive ways to move deeper into your data—and each, with the
underlying data, can be quickly exported to include in reports and
presentations.
The power to visualize your data!
Over 40 interactive data visualizations including bar charts,
pie charts, bubble plots, grid charts, word clouds, and so much
more!
All visualizations are fully exportable to PDF and Excel with
all underlying data intact!
All chart features include full excerpt click-through and the
underlying excerpts can be exported to Word or Excel with all
associated data!
Informative and compelling visualizations simplify the
communication of research results and findings
Dynamic and interactive—these visualizations serve as windows
into the depths of your data and all excerpting and coding activity
Easily view your descriptor ratios, code application activity,
code application correlation, code by descriptor break-out, and the
list goes on…and on
Dynamic Code Tree
The
Code Tree Manager allows you to import, export, merge,
create, order, and edit weighted and non-weighted codes at
any time
Editing
a code in the Dedoose Code Tree Section
The Dedoose code-tree is incredibly flexible. Newly-created codes can
expand the tree horizontally or vertically, code definition and exemplar
information can be accessed with a click of the mouse, and your custom
rating, ranking, and/or weighting systems can be defined and activated
with ease. The code-tree is also fully dynamic in its functionality. At
any time you can modify the tree by simply dragging and dropping a
particular code from one branch of the tree to another and all the work
you've done with that code up to that point follows right along…true for
code merging too! (And not to worry, Dedoose allows project managers to
decide who can alter the code system and who can’t—you control all
access and control privileges)
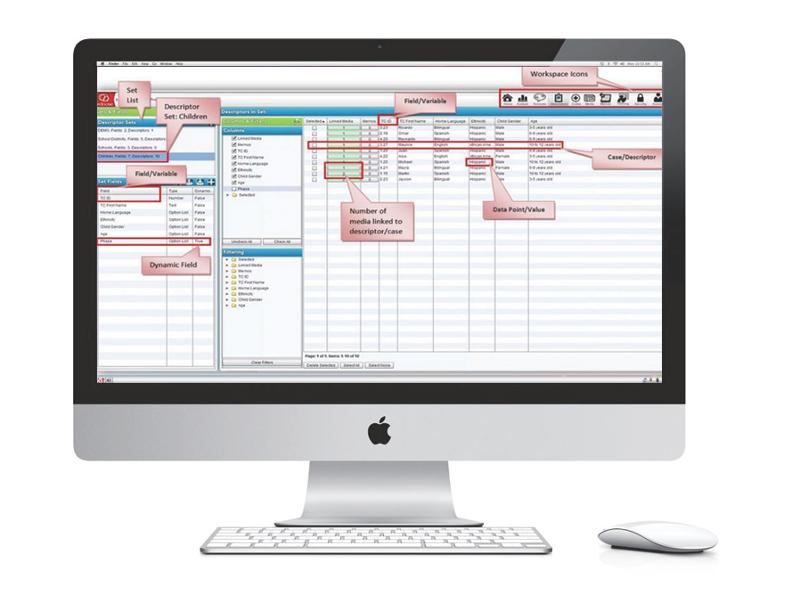
Resource and Descriptor Data Managers
The
Resource workspace allows users to add, edit, delete,
filter, import, and export resources that are contained in a
project
The
Descriptor workspace allows you to easily edit and integrate
quantitative data into your project
Resources are your interviews, stories, fieldnotes, focus group
transcripts, audio files, video, photos—your qualitative data.
Descriptors are the demographics, quantitative variables, test scores,
and other identifiers for each case, person, transcript, setting…in your
database. These descriptor data—all the information you collect about
the individuals, groups, or settings that are the focus of your
research—can take many forms (e.g., numeric, textual, date,
categorical/nominal and others).
Dedoose resource and descriptor manager features and wizards guide
you quickly through the process of importing all your project data via
commonly used file formats so you can get working right away. Further,
smart import engines assure the reliability and validity of your data as
you bring them to Dedoose—you’ll see previews and data verification
reports on possible problems alongside clear solutions before you upload
your project data into Dedoose.
Levels of Analysis and Time
Dedoose provides the ability to create multiple descriptor sets within a
single project to deal with the real and natural complexity of the
worlds people live in. For example, create one for individuals, one for
families, and one for communities and your analyses can reach across
these levels to fully represent the natural complexity of phenomena and
effects. Change over time can be assessed using Dedoose dynamic
descriptor fields. Define a descriptor field as dynamic and you set the
value for each new resource you submit to Dedoose. For example, when
doing multiple interviews or focus groups over time you can set the
‘Time’ variable as ‘Baseline,’ ‘Time 1,’ ‘Time 2’… think natural
development or the effects of your program, advertising, news event
changed something? With dynamic descriptor data, Dedoose makes the
identification and understanding of change over time fast, visual, and
straightforward.
Excerpting Made Easy
The
Excerpting Section of Dedoose allows a user to see and edit
excerpts for a project
By
clicking on an excerpt a user can bring up the full excerpt
info
Easy excerpting—marking sections of an interview, notes, focus group, or
other resource for coding is at the heart of Dedoose. Once identified,
excerpts can be described in a memo, assigned any number of codes, and,
if you choose, rated based on any rating/weighting system you have
defined for a code. Dedoose excerpting, colorization, and excerpt
indicator and information features make the process easy and
transparent. Further, viewing your excerpting work is in your face on
the Dedoose screen, and it’s easy to activate and modify excerpts (and
their coding) at any time.
Data Visualization, Filtering, and Analysis
Menu-driven
evidence-based conceptual maps provide visual insights in
multiple dimensions with full click-through capabilities
Menu-driven
charting and graphing engine to quickly customize your
visuals for pattern discovery, drill-down access, and easy
export
Organize
and understand variation in your sample population at a
glance
If excerpting (coding meaningful segments of information) is the heart
of Dedoose, then the Dedoose data visualizations, filtering, and
analysis features are its brain. Together, these features provide
automatically generated, visually compelling, and informative
presentations of your data and coding activities. These visualizations
are gorgeous, information-rich, and ready to drop right into your
presentation.
Easily view your descriptor ratios, code application activity,
code application correlation, code by descriptor break-out, and the
list goes on…and on
Filtering
Using
the Data Selector in Dedoose allows a user to filter based
on any piece of data in your project
Have more complex questions? Want to drill deeper into your data? The
Dedoose ‘Data Selector’ allows you to filter based on ANY piece of data
in your project. Complex searching and filtering can be daunting, but
Dedoose is designed to keep it all transparent. Intuitive and powerful
filtering via Boolean operators and sorting features allow easy
examination of results from any number of perspectives. Combine excerpts
or resources into subgroups based on any combination of filters (e.g.,
by type of resource, user, participant characteristics, code, or
quantitative data on individuals or groups) and move seamlessly back and
forth between the results, your excerpts, and your resources. Powerful
and intuitive on the surface, but easy to navigate and you will never
lose track of where you’ve ventured into your data since Dedoose always
shows indicators of the filtering activity and provides toggles to
compare filter results with the full data set.
Analysis
Interactive
4-Dimensional Bubble Plot Data Visualization with full
excerpt click through
The Dedoose Analysis Center is filled with a wide range of data
visualization options—through the menu-driven bar charts, pie charts,
and conceptual maps (bubble plots), it’s easy to dig in, discover, and
explore what sits beneath the surface. Like what you see? Prepare and
export results to your desktop on the fly—and it’s easy and quick to
recreate similar analyses after making changes to the underlying data as
any filtering can be saved in a library with user-generated descriptions
to reactivate in the future.
Training Center
The
Dedoose Training Center allows teams to establish, maintain,
and document inter-rater reliability for both code
application and code weighting
We recognize the importance of establishing and maintaining reliability
for both your tagging/coding application and weighting. The Dedoose
Training Center is a unique and easy-to-use feature for teams to
establish and maintain inter-rater reliability. Your tag/code system
represents the conceptual framework you have developed to understand and
communicate your findings to others. Demonstrating reliable application
of this system to your data is fundamental to the strength and
credibility of the arguments you present to your audience and the
confidence you will have in your data and the results of your analysis.
In the Dedoose Training Center, project leaders prepare training
sessions by setting standards for code application and code
weighting/rating. You select which codes and excerpts to include in a
‘test’ for training and establishing reliability. These excerpts and the
associated coding/ratings become the basis for training and evaluating
the performance of your team members and Dedoose provides many
diagnostics to assist in this process.
Once your team has discussed the codes, definitions, and application
criteria, you want to assure that all members will be following these
rules in consistent ways. Your team can then ‘train’ online in the
Training Center to demonstrate their coding proficiency, learn from the
mistakes, and document the successes. They can perform these exercises
independently with considerable online support from Dedoose and the
results are available to team leaders to assess the strengths and
weaknesses of each coder. For code application, Dedoose calculates and
presents both a pooled Cohen's Kappa for inter-rater reliability across
all codes in the test and a Cohen’s Kappa for each individual code. For
code weighting/rating, Dedoose calculates Pearson’s correlation
coefficient and other diagnostics on relative agreement. Further, beyond
the simple metrics indicating proficiency levels, a range of diagnostic
details are provided to help identify where and what additional training
would be required, including item-by-item comparisons between the expert
and trainee coding/rating. The team can discuss and master coding and
answer questions online at any time from any location!
Security
The
Dedoose Security Workspace allows project administrators
full granular control over all project user activities.
Your data are safely encrypted and protected, and we’ve got your
back…up! Have you ever had a hard drive crash? Some estimate that
140,000 hard drives crash every week in the United States alone. Let’s
face it, in every industry there are ‘acceptable’ rates for product
failure. Independent research estimates of hard drive failure rates
range from 1.7% for new drives to over 8.6% for drives in their third
year of use. At all times, Dedoose project data remains secure and
safely mirrored, backed-up, and protected according to the highest
industry standards. You'll never worry about computer theft, disk
failure, memory loss, file corruption, or any of the other problems that
can plague your own computer and result in the loss of your valuable
work—now that feels safer! And if you want to download your data, your
welcome to export everything at anytime. To see a complete overview of
our data security protocols please
click here.
Although we have strived to make Dedoose incredibly intuitive, we
have provided many support options for new and experienced users. A set
of helpful videos introduce and provide step-by-step instruction for all
critical project tasks. Similarly, the Dedoose user guide was written
with extensive detail and contains thorough information on how to get
started and get the best out of what Dedoose has to offer. The growing
list of FAQs provides response to the questions users pose most. And,
finally, the SocioCultural Research Consultants team (the team that
brought you Dedoose) is prepared to provide access to our network of
research professionals trained and experienced in all aspects of social
science and marketing research.
Fanatic Support:
The video tutorials offer in-depth guides into all areas of
Dedoose and mixed methods research
The User Guide offers thorough step-by-step instructions for all
Dedoose features
The Dedoose Forum offers a great way to collaborate with all
Dedoose users and the Dedoose team
Our team is filled with experienced and well-published
qualitative and mixed methods researchers
We rapidly respond to all email and phone questions
If Dedoose is missing a feature you want, we have a proven track
record of delivering on these requests in our forum
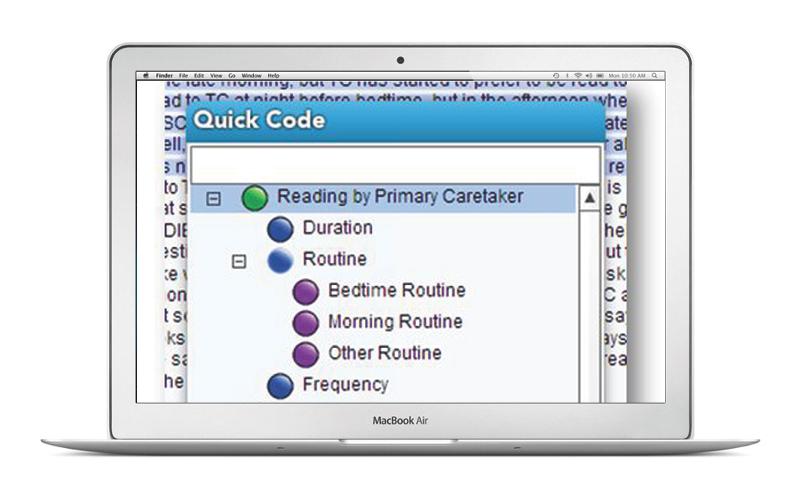
Learn More...
Fast.
Dedoose just got easier.
We asked our users what they wish they would have known
when they started using Dedoose so you could learn best
practices faster.
The #1 recommendation? Glad you asked...'Use our Quick Code
Widget to save yourself a ton of time when coding.' To learn how
to use this feature and read up on several other timesaving (and
best practice) tricks click here.
And since you
are just starting out, we want to make sure you know how to find
the help you need right from the get go.
Visual learner? Check out our
video tutorials
here for a workspace by workspace walk through of Dedoose -
all guided by our fearless leader, CEO and Co-Founder, Eli
Lieber.
And if you prefer text we also
have a User Guide - or wiki as we call it. This
will give you a step-by-step tour of all of the elements of
Dedoose in greater detail. Check it out
here.


 Dedoose is a web based application that allows users to analyze qualitative and mixed methods research data from any internet enabled device. Researchers and marketing teams use
Dedoose to excerpt, code, visualize and drill into integrated qualitative and quantitative
data - yielding new insights into key target markets and research populations. Dedoose was designed by researchers for researchers and our team remains firmly embedded within the professional academic research community. Dedoose was developed as a needed low cost alternative to
NVivo, Atlas.ti, Maxqda, and other qualitative data analysis software. Beyond traditional qualitative data analysis, Dedoose includes fully integrated mixed methods features and efficiently supports collaboration like nothing before in a multi-platform and user experience optimized environment.
Dedoose is a web based application that allows users to analyze qualitative and mixed methods research data from any internet enabled device. Researchers and marketing teams use
Dedoose to excerpt, code, visualize and drill into integrated qualitative and quantitative
data - yielding new insights into key target markets and research populations. Dedoose was designed by researchers for researchers and our team remains firmly embedded within the professional academic research community. Dedoose was developed as a needed low cost alternative to
NVivo, Atlas.ti, Maxqda, and other qualitative data analysis software. Beyond traditional qualitative data analysis, Dedoose includes fully integrated mixed methods features and efficiently supports collaboration like nothing before in a multi-platform and user experience optimized environment.
 Orientation:
 Dedoose is designed to work in all modern browsers
 Login
- Your Browser, the Internet, and Adobe Flash is all you
need to access all Dedoose has to offer
Login
- Your Browser, the Internet, and Adobe Flash is all you
need to access all Dedoose has to offer
 Home
Dashboard — Login for instant access to all project
components
Home
Dashboard — Login for instant access to all project
components
 Filter
by user to monitor or access the work by particular
individuals
Filter
by user to monitor or access the work by particular
individuals Check-box
filtering and gauges for filter activity monitoring
Check-box
filtering and gauges for filter activity monitoring Customizable
spreadsheet-familiar ‘Managers’ to view, browse, filter and
organize all aspects of the project database
Customizable
spreadsheet-familiar ‘Managers’ to view, browse, filter and
organize all aspects of the project database Data
tips open when floating over charts and graphs to cue the
data being represented
Data
tips open when floating over charts and graphs to cue the
data being represented Menu-driven
evidence-based conceptual maps provide visual insights in
multiple dimensions with full click-through capabilities
Menu-driven
evidence-based conceptual maps provide visual insights in
multiple dimensions with full click-through capabilities Menu-driven
charting and graphing engine to quickly customize your
visuals for pattern discovery, drill-down access, and easy
export
Menu-driven
charting and graphing engine to quickly customize your
visuals for pattern discovery, drill-down access, and easy
export Organize
and understand variation in your sample population at a
glance
Organize
and understand variation in your sample population at a
glance The
Code Tree Manager allows you to import, export, merge,
create, order, and edit weighted and non-weighted codes at
any time
The
Code Tree Manager allows you to import, export, merge,
create, order, and edit weighted and non-weighted codes at
any time Editing
a code in the Dedoose Code Tree Section
Editing
a code in the Dedoose Code Tree Section The
Resource workspace allows users to add, edit, delete,
filter, import, and export resources that are contained in a
project
The
Resource workspace allows users to add, edit, delete,
filter, import, and export resources that are contained in a
project The
Descriptor workspace allows you to easily edit and integrate
quantitative data into your project
The
Descriptor workspace allows you to easily edit and integrate
quantitative data into your project
 The
Excerpting Section of Dedoose allows a user to see and edit
excerpts for a project
The
Excerpting Section of Dedoose allows a user to see and edit
excerpts for a project  By
clicking on an excerpt a user can bring up the full excerpt
info
By
clicking on an excerpt a user can bring up the full excerpt
info
 Using
the Data Selector in Dedoose allows a user to filter based
on any piece of data in your project
Using
the Data Selector in Dedoose allows a user to filter based
on any piece of data in your project
 Interactive
4-Dimensional Bubble Plot Data Visualization with full
excerpt click through
Interactive
4-Dimensional Bubble Plot Data Visualization with full
excerpt click through
 The
Dedoose Training Center allows teams to establish, maintain,
and document inter-rater reliability for both code
application and code weighting
The
Dedoose Training Center allows teams to establish, maintain,
and document inter-rater reliability for both code
application and code weighting
 The
Dedoose Security Workspace allows project administrators
full granular control over all project user activities.
The
Dedoose Security Workspace allows project administrators
full granular control over all project user activities.
 The
easy-to-read Dedoose
The
easy-to-read Dedoose